Introduction
Enter the wild and thrilling frontier of Wikispeedia, a game where players must navigate from one Wikipedia article to another by following hyperlinks. It’s a challenge of strategy, knowledge and wits, testing how quickly and efficiently you can travel through the expansive web of interconnected articles.
What makes some articles the trusty steed that carries you to victory? Why do others lead you astray, wandering like a lone ranger in the desert?
Here, we saddle up to decode the secrets of the trailblazing articles. Through data-driven insights, we’ll uncover how these key topics guide players through this untamed maze of hyperlinks.
So, partner, ready to ride into the unknown? Let’s hit the dusty trail and unravel the mystery together!
Listen along while you discover the data!
Exploring the data frontier: An insight into article data
Articles are the steady horses that carry players to victory, guiding them through the winding trails of hyperlinks. Here’s what we’ve learned about these horses and their traits:

1. Different Categories
Every horse belongs to a breed, a category. But are some breeds more common than others?
Geography and science dominate the herd, with art and mathematics fewer in number. The strongest steeds might be from the most common breeds, but it’s worth exploring which categories are found among the champions.
2. Incoming and Outgoing Links
A horse’s strength lies in its legs, or the number of links it has :
When we look at the incoming links, it's clear that geography dominates, with 8 out of the 10 most linked-to articles falling into this category. Locations like "United States" and "United Kingdom" are frequently linked to a wide range of topics, acting as key landmarks on the trail that Cowboys can use to guide them. The "United States" article, in particular, stands out not only for its high number of incoming links but also for having the most outgoing links, further solidifying its role as a central hub in the network. Articles that are simply lists, like "List of countries," also tend to have many outgoing links, acting as directories that connect to a wide variety of other articles. Overall, Geography, with its far-reaching connections, seems to be the backbone of the map guiding players across this vast terrain of information.
3. Hyperlink Density
Some horses are nimble, with a high density of links :
Articles with shorter lengths but many links often stand out in terms of hyperlink density, providing numerous connections without overwhelming the reader. These concise, link-rich articles serve as efficient waypoints, guiding players quickly across the network without slowing their progress. It looks like list-based articles exemplify this, acting as quick pivots for wandering cowboys, but offering less substance for the journey itself.
4. Semantic Distances
When we look at the relationships among horses, interesting patterns emerge :
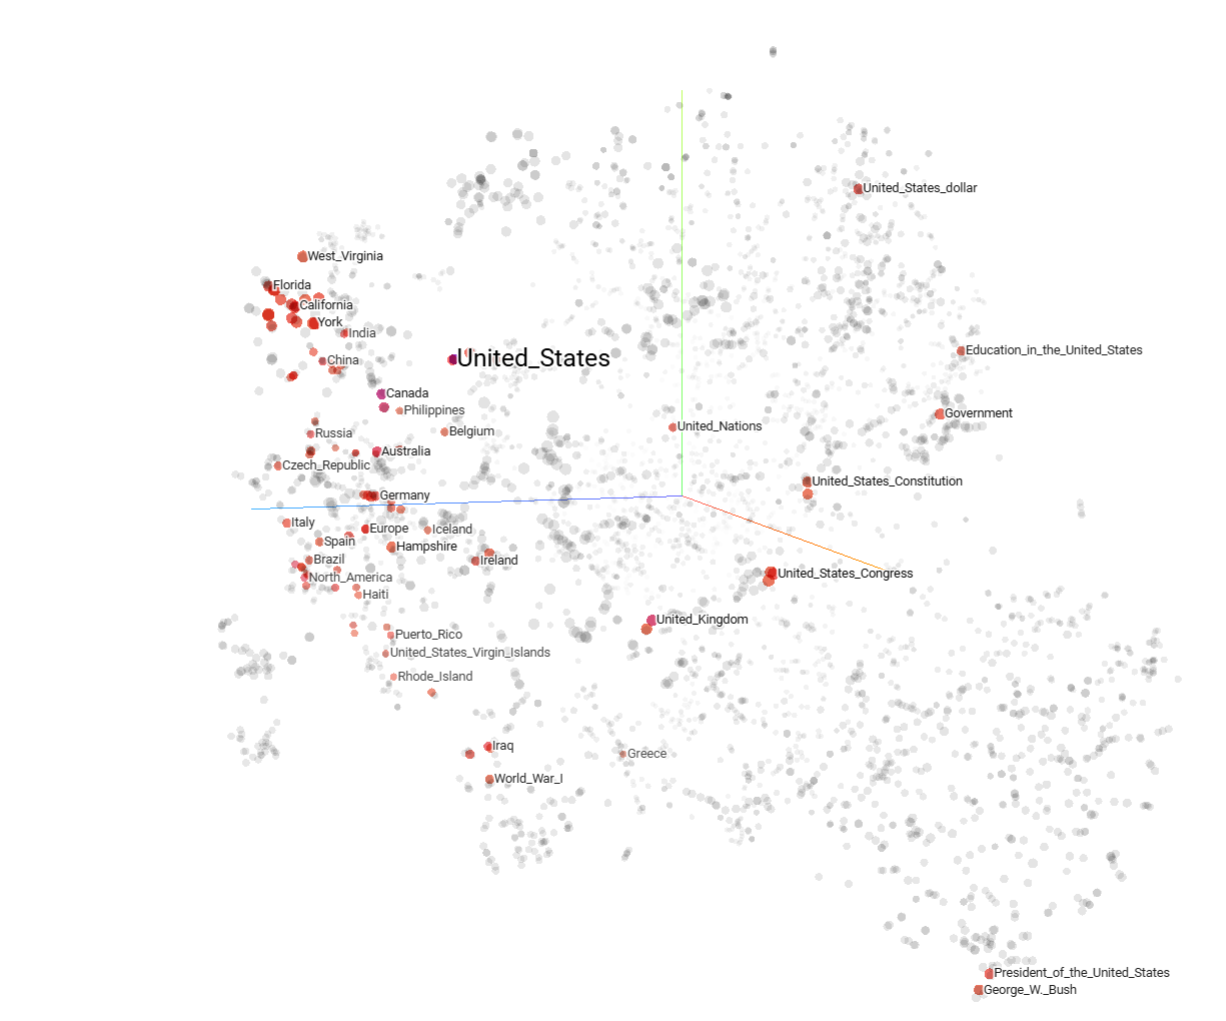
Tools like T-SNE reveal fascinating clusters, showing how articles are semantically connected. For example, "United States" occupies a central position within its network, highlighting its role as a hub. These distances allow us to visually map the relationships and closeness between topics.
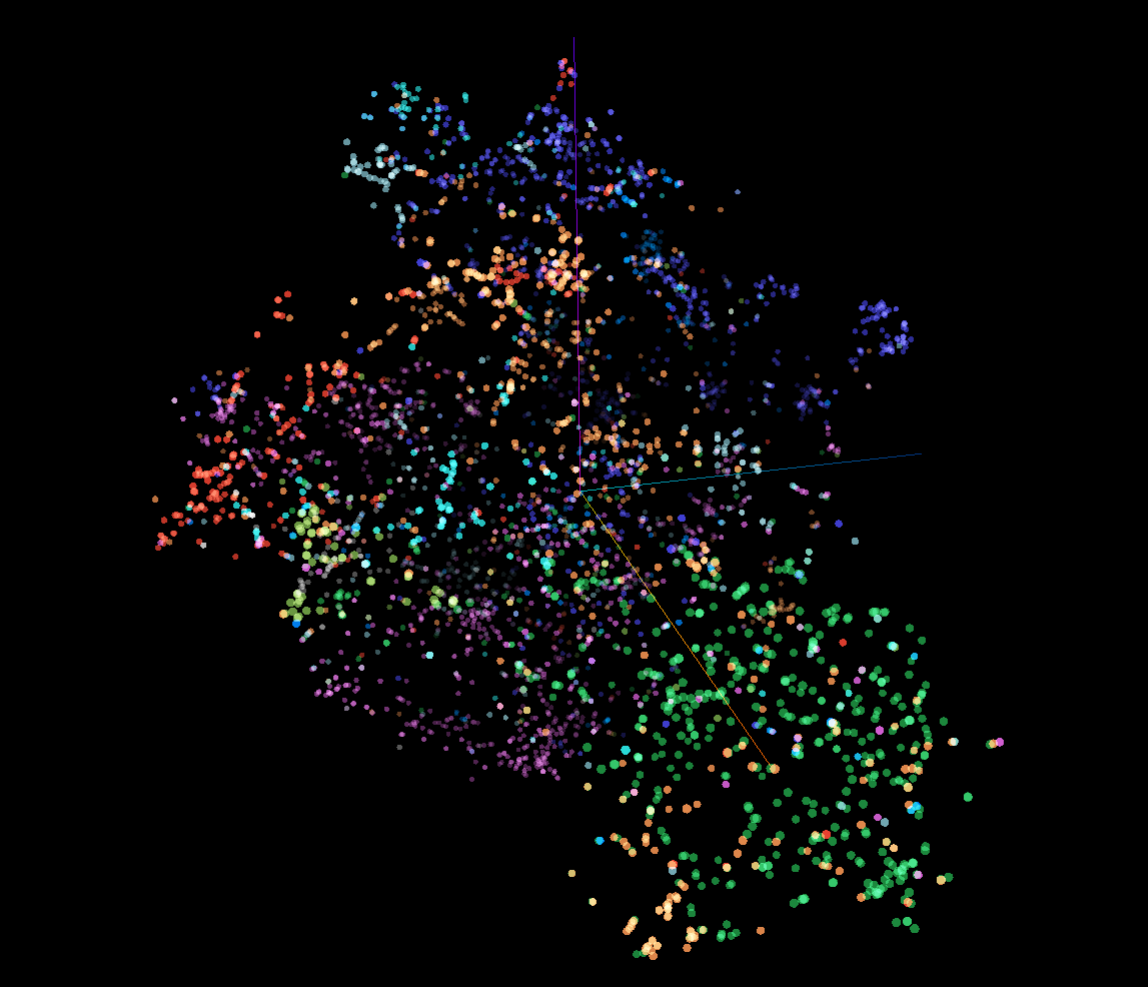
This plot gives us a clear picture of how our embeddings work as a way to measure the closeness and categories of articles. We can see how articles naturally group together. For example, the green dots represent articles in the "People" category, while the orange ones belong to "History." Similar clusters appear for all major categories, showing just how connected these topics are. It’s like mapping out the trails a cowboy might follow, the connections mirror the way players naturally think about how topics link together. Just like in the Wikispeedia game, where you don’t see the full map, you’ve got to rely on your own instincts and associations to find your way.
Our exploration highlights the unique attributes of these articles, from their category names to their navigational strength, helping us understand how they shape the cowboys' trails.
Navigating the trails: an insight into played paths
Some paths are quick trails to victory, while others are just false leads or dead ends in the wild west of Wikispeedia.

Let's start by looking at how many of our cowboys made it to their target:
Well, partner, looks like about 70% of our cowboys made it. That’s a whole lot of sharp-shootin’ and straight-ridin’! The other 30%? Maybe they got distracted by a cactus, chased a tumbleweed, or just decided the saloon back home was calling their name.
Let me tell you about simplified trails, partner. A simplified path is one where we’ve cleaned things up by removing any unnecessary loops and backtracking. We’re only left with the most direct route that the cowboy took to reach their target, cutting out the fluff and leaving behind just the essentials.
Below is the distribution of path lengths for the finished cowboy trails. You can toggle between different path types to compare the journey lengths.
Interesting insights ahead, partner! Looks like some trails wander far and wide, much longer than the rest. Maybe those cowboys were out sightseein’, or perhaps they just took the scenic route to soak up the prairie sun. Some of these outlier paths are so long that we had to cut off the graph at 30, but don't let that fool you — the maximum path length actually reached over 400!
When we dig deeper, it seems a couple of cowboys found themselves locked in a duel over the same trail. Time and again, they retraced their steps between the same starting and target articles, each striving to outdo the other.
In the end, these Cowboys demonstrated how revisiting the same path might seem like a clever strategy, but it skews the game’s true spirit.
Let’s take a closer look at how we ensure that only trails are considered that are meaningful for the scoring ahead.
We refine the completed paths by applying the following criteria:
- One Trail Per Cowboy-Target Pair: As we saw, cowboys are smart—they sometimes retrace their steps to learn the best route. However, we only keep one unique trail for each cowboy's attempt at a start-target pair to ensure we aren’t biased by repeated attempts.
- Fair Share of Trails: Starting and arrival points should be distributed more uniformly. Trails are limited so that each starting point and target point is limited to 10 to prevent overrepresentation of certain trails.
- No Trails to Nowhere: Trails with a distance of 0 are excluded.
- Outliers Beware: Using the Interquartile Range (IQR) method, we rope in the good trails and leave out the statistical outlaws. We filter out trails with extreme lengths or durations.
Even incomplete paths can provide valuable insights but need to first be refined as well:
- Fair Share of Trails: Just like for finished trails, this allows to prevent biases due to overrepresentation.
- Outlier Lengths: Exclude unusually long trails using the IQR method.
- Trail Sanity Check: If the simplified trail is shorter than the minimum possible distance, we mark it as implausible and exclude it.
Article Scoring: Ranking the Steeds
Now, partner, it’s time to score these trusty steeds and determine which ones guide our cowboys through the rugged trails. How can measure an article's "goodness"?

Graph theory based ranking
When analyzing the network of articles, where the articles serve as nodes and the links as edges, graph theory provides a powerful tool for identifying those that play a central role in navigation. Using a graph theory-based metric, we evaluate an article’s importance by examining how often it appears in the shortest paths connecting all possible source and target pairs. To ensure fairness, we normalize these counts by the total number of shortest paths for each pair, preventing any bias toward articles that dominate only specific routes.
Interesting! This shows that topics tied to powerful countries (like the United States and the United Kingdom), vast regions (such as Europe and Africa), and major historical events (like World War II) are riding high in the rankings. We also saw this reflected in the number of incoming hyperlinks these articles receive, which is to be expected, as their centrality and broad relevance make them key connectors in the network. These geopolitical, regional, and historical themes are therefore proven to be the backbone of the network, acting as key links between all kinds of different topics.
Played path based scoring
Graph theory alone doesn’t capture the full picture. To understand which articles are most valuable in carrying cowboys to their targets, we analyze the trails they actually ride on; the played paths. The metrics we introduce reflect what articles tend to lead players most effectively to their destination, derived directly from their navigational choices and the strategies they employ.
Wikispeedia challenges cowboys with a dual objective: to reach the target as quickly as possible or to do so while taking the shortest route. While shorter trails are often faster, that’s not always the case. Sometimes, a longer trail across familiar terrain, articles more widely known among players, can lead to quicker success. To capture these dynamics, we separately calculate scores that reward both minimal path length (fewer clicks) and minimal path duration (faster navigation).
Scores Rewarding Minimal Clicks
Path weights are our first metric for determining trail efficiency. These weights measure how closely a cowboy’s chosen trail matches the shortest possible path by calculating the ratio of the optimal distance to the simplified trail length. The closer a weight is to 1 the more efficient a path is. From these path scores, we derive two types of article scores:
- Average of the Weights: Average weight of the paths an article appears in.
- Sum of Centered Weights: This score centers the path weights around 0 by substracting their mean weight, then sums these centered weights for all paths were theh article appers.
One might think that these two scores should basically be the same, however, this is not the case. The distinction is important: articles with the highest average weights are those that reliably appear in near-optimal paths, representing article quality. On the other hand, articles with the highest sum of centered weights can just have above average weights, but appear a lot more frequently, reflecting article utility.
While the weight scores capture efficiency, they don’t tell the whole story. Two additional metrics help us assess how articles affect navigation in other ways. The Detour Ratio Score measures the proportion of times an article appears in detours, parts of the trail that required backtracking, compared to its total appearances in finished paths. Additionally, the Unfinished Ratio Score tracks how an article shows up in incomplete paths versus all paths. In both cases, a high score suggests the article might mislead cowboys, nudging them onto less effective paths.
Finally, we bring it all together with Composite Scores , combining one of the weight-based scores with the detour and unfinished ratio scores. This weighted sum prioritizes the weight score while giving smaller emphasis to the two ratio scores, providing a sophisticated measure of an article’s performance as a guide on the trails. Below we present the top 5 articles with the largest composite quality scores (weighted sum of average weight, detour ratio, and unfinished ratio after scaling) and utility scores (weighted sum of sum of centered weight, detour ratio, and unfinished ratio after scaling).
Geography rides tall in the saddle once again, partner. For the utility score, nearly every top-ranking article is tied to geographical themes. From sprawling regions to powerful nations, these landmarks continue to steer cowboys across the vast network. On the other hand, the quality score highlights seemingly more random articles like "Tennis" and "Harry Potter". We suspect these to be precise waypoints, less common but crucial stops for cowboys who knew exactly where they were heading. There is a very clear difference in the number of appearances of the top articles between the two scores, further emphasizing the distinction between the average and sum of centered weight scores, as we discussed above
Scores Rewarding Fast Path Completion
Just as article weights rely on path distances, article times can only be determined after calculating the times for all trails. Instead of simply using the raw times taken to complete a path, we compute adjusted path times that factor in the optimal distance of each trail, scaling the times accordingly. Specifically, since the most common start-target distance is 3, times for other distances are scaled to align with the median time of distance 3. This ensures that differences in path times caused by varying levels of difficulty, reflected in differing path distances, are accurately accounted for.
Using these adjusted path times, we calculate adjusted article times, mirroring the two methods used for article weight scoring. As before, the distinction between these two scores reflects the balance between quality and utility of an article to the players.
- Average of the Adjusted Times: Represents the average adjusted time for each article
- Sum of Centered Adjusted Times: This score centers the adjusted path times by substrating their mean, then sums these centered values for all paths where the article appears.
It’s interesting to see how the top articles for the two time scores highlight different roles in the journey. For the centered sum score, the standout articles are those that appear frequently on well-traveled trails, like "United States" and "Europe." These are followed by others with high usage, such as "Periodic Table" and "Presidents of the US." Their frequent presence on many trails reflects their utility, making them dependable companions for players navigating diverse paths. On the other hand, the average time scores reveal a different kind of value. Articles like "Great Lakes" and "Harry Potter" may not appear on as many trails, but when they do, the journey tends to be efficient, with players reaching their destinations quickly. This contrast illustrates the dual nature of article value again. Some are reliable workhorses, widely used and essential for many routes, while others offer high-quality, efficient contributions in specific situations. Together, these scores provide a nuanced view of how articles support the player’s pathfinding experience.
Given the clear parallels between the click-based utility and quality scores and the time-based metrics, specifically, the weighted sum of times and the average time scores, it’s worth examining these connections more closely. Therfore, we compare them in the plots below.
Make sure to use the scrollbar, to understand the meaning of the dots' colors! It is also important to mention that the scores are standarized and computed in a way that bigger is better. So, for example, a large average adjusted time scores reflects a fast completion time.
The metnioned parallels turn out to be quite clear correlations. It’s not surprising that completing a path in fewer steps often results in faster times. What’s particularly interesting, however, is the strong correlation between the composite quality score (based primarily on the average weight score) and the average time scores. Similarly, the utility composite score, which is mainly driven by the sum of centered weight scores, aligns well with the sum of centered time scores. This highlights how both quality and utility contribute consistently to the efficiency of a player's journey.
Analysis of attribute and score correlation
You might be wondering if the defined scores show any meaningful relationship with the article attributes. Let's dig into the data and find out!

Correlation analysis based on the played paths data.
Before diving into the correlations, let’s first clarify the more nuanced attributes we consider:
- Average Max Cosine Distance: This metric calculates the average of the top 3 largest cosine distances between the article title embedding and the directly linked article title embeddings. It’s designed to capture the potential for large semantic jumps, which could indicate shorter, more efficient paths between articles.
- Average Min Cosine Distance: The inverse of the above, this metric focuses on the smallest cosine distances, helping identify articles that are semantically close to others, potentially indicating a more direct or connected route.
- PageRank: A graph theory-based metric that assesses the importance of an article (node) within the network. It evaluates how well-connected an article is, giving higher scores to those linked to other highly-ranked articles. PageRank reflects an article’s influence and centrality in the overall network.
- Betweenness Centrality: Another graph theory metric that measures how often an article (node) acts as a bridge along the shortest path between two other articles. Higher betweenness centrality indicates an article’s role in connecting different parts of the network, making it a key node for navigation.
The two plots below show the correlation of our article attributes with our two composite scores. The first plot shows scores that emphasize a minimal number of clicks, whicle the second shows scores that emphasize a short path completion time. None of the attributes based on in-article features correlated heavily with either of our two scores. However, graph-based attributes correlated well with utility across both composite scores. The failure of in-article attributes to correlate with our article metrics implies that there is no such thing as a "good" article, as derived from its textual attributes. Instead, the only features of a given article which we can make generalizable statements on are those removed from the text itself: the graph attributes. This begs the question: what is to blame: our attributes or the dataset? In order to get a firmer understanding of our attributes' shortcomings, we decided to create our own dataset of traversed paths.
Fast Draw: Another Way to Play.
In the Wild West, it was common that disputes were settled with a battle of reflexes: fast draw. Anecdotally, this is the way that many people play the Wikispeedia game. These players don't pour over articles for outgoing links, and they certainly don't take the time to read different articles. Instead, these players rely on their own assumptions about the structure of the graph. When choosing a next article, they don't necessarily vocalize a strategy of navigating to a larger hub and then incrementally refining their article choice: they simply choose the next article that is most similar to their target article. Our current player-made paths dataset does have a few of these sharpshooters, but they are lost in the noise. What if we could play the Wikispeedia game like these players? Would our attributes correlate any differently on these kinds of paths?
The first step is to define our strategy for selecting the next article given a current article and a target article. We could use the categories and their tiers. However, we run into problems if we just use the binary classifications provided to us by the categories. There is no clear way to evaluate distance between different completely category types. Thankfully, due to our embeddings, we already have a numeric representation of semantic distance! This makes our algorithm for playing Wikispeedia much simpler.
    For each start, end in paths:
    current_article = start
    while current_article != end:
        Out of the possible next articles, choose the article that satisfies the following conditions:
            1. we have not visited
            2. has the smallest cosine distance to the end of the path
        If no articles satisfy this, discard the path.
Using this algorithm, we can play any Wikispeedia path we want! In order to make comparing the correlation of our attributes to our prospective metrics, we will use this algorithm to play the same filtered paths as before. After playing those paths, we can compute corresponding utility and quality scores for the articles in our bot-generated paths. Before computing these scores, we filter our bot-generated paths in the same way we filtered the player-made paths: downsampling and IQR filtering. Note that the utility and quality in this case are just the sum of centered weights and average weight scores, as detailed above. Time and composite scores are not relevant in this case.
Yee-Haw! Looks like this quick-draw way of playing is a much better fit for our attributes! The graph-based attributes especially correlate with our scores generated on these types of paths. One possible interpretation of this change in the correlation data is that specifying a strategy for the Wikispeedia game results in more consistent data. That is to say, the player-made paths (even our filtered version) are made up of many different players each playing in their own way with their own strategies. Our increased correlation after generating paths for just one strategy supports this understanding of the dataset.
At the same time, the implication that article-specific attributes are more relevant only when a single player archetype plays the game implies that no such thing as an universally good article exists. One might think of a "good" article in terms of a specific path: the idea that you can only evaluate an article given a goal. However, this increase in correlation reveals there is something else that makes a "good" article: the player. What a player would consider good about an article differs from player to player. If a player prefers to take their time and read through all of the different out-links, then link density is best. If a player is not necessarily playing to win but rather explore Wikipedia, then the number of characters is a desirable attribute. After all, Wikispeedia is a game, and people play games to have fun. What one person considers to be "fun" may be entirely different from another person.
At the end of the day: there are no "good" or "bad" (or even "ugly") horses: just cowboys riding the trail together.
Thanks for ridin' along with us!